
Analysis
ETFs
Analysis coverage in ETFs.

ETFs
Sequence of Returns Risk: Same Returns, $671,719 Apart
An original 20-year model shows why identical returns can produce different retirement outcomes—and what withdrawals, inflation and spending flexibility change.

ETFs
ETF vs Index Fund: 10 Years of Data Show What Really Matters
ETF vs index fund compared with 10 years of verified S&P 500 data: VOO, IVV, SPY vs VFIAX, FXAIX, SWPPX — returns, fees, taxes and which to choose.

ETFs
Equal Weight S&P 500 vs the Regular Index: 23 Years of Data
The top 10 stocks now make up 38.9% of the S&P 500. We compared the equal-weight version across 23 years of total returns to see when it wins, when it loses, and why.
ETFs
Best ETF to Buy Now (2026): Picks by Goal and Risk Level
What ETF should you buy right now? A dated, condition-aware guide to the strongest ETFs for a core holding, income, safety, inflation and growth in 2026 — with costs and sizing.
ETFs
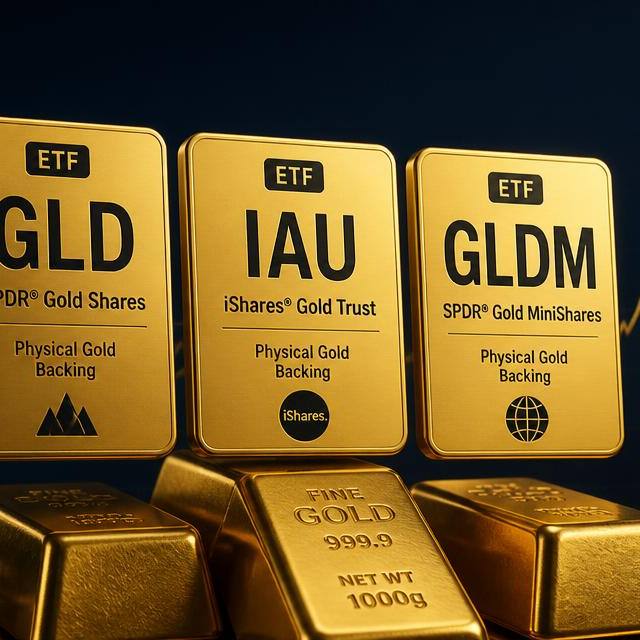
Best Gold ETF 2026: GLD vs IAU vs GLDM Compared
Compare the best gold ETFs for 2026 — GLD, IAU, GLDM, SGOL and the miners — on expense ratio, liquidity, structure and tax, with a clear pick for each type of buyer.
ETFs
Best ETFs 2026: Top Picks by Category (Index, Growth, Dividend, Gold)
There is no single best ETF — only the best one for each job. The strongest 2026 picks across index core, growth, dividends, bonds, gold and international, with costs and who each suits.
ETFs
VTI vs VOO 2026: Total Market or S&P 500 — Which Vanguard ETF Wins?
VTI and VOO both cost 0.03% and overlap by roughly 85%. A side-by-side comparison of holdings, returns, concentration and when each Vanguard ETF is the better buy.
ETFs
VOO vs SPY 2026: Which S&P 500 ETF Should You Buy?
VOO and SPY track the same index but differ on cost, structure and liquidity. A side-by-side comparison of fees, tracking, dividends and options depth — and which S&P 500 ETF fits your account.